USERS
Conference and Show Management, Exhibitors
PURPOSE
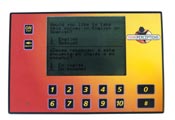
• To provide an easy-to-use electronic exhibit measurement system that collects instant feedback on-site from trade show attendees
• Attract attention and traffic to the exhibit
SUGGESTED SURVEY TOPICS
• Profile quality of attendees/booth visitors (e.g.; interests and buying plans)
• Assess interest in conference topics
• Determine interest in new products
• Rate presentations at the exhibit
• Determine industry trends
• Determine reader preference among industry publications
BENEFITS OF ELECTRONIC SURVEY UNITS
• Quick Turnaround - Report is available within three weeks after the show.
• Customized Survey - Survey is customized to meet your specific needs.
• Easy And Fun To Use - Booth visitors enjoy their time doing the survey.
• Attracts Attendee Interest - Draws potential buyers to your booth.
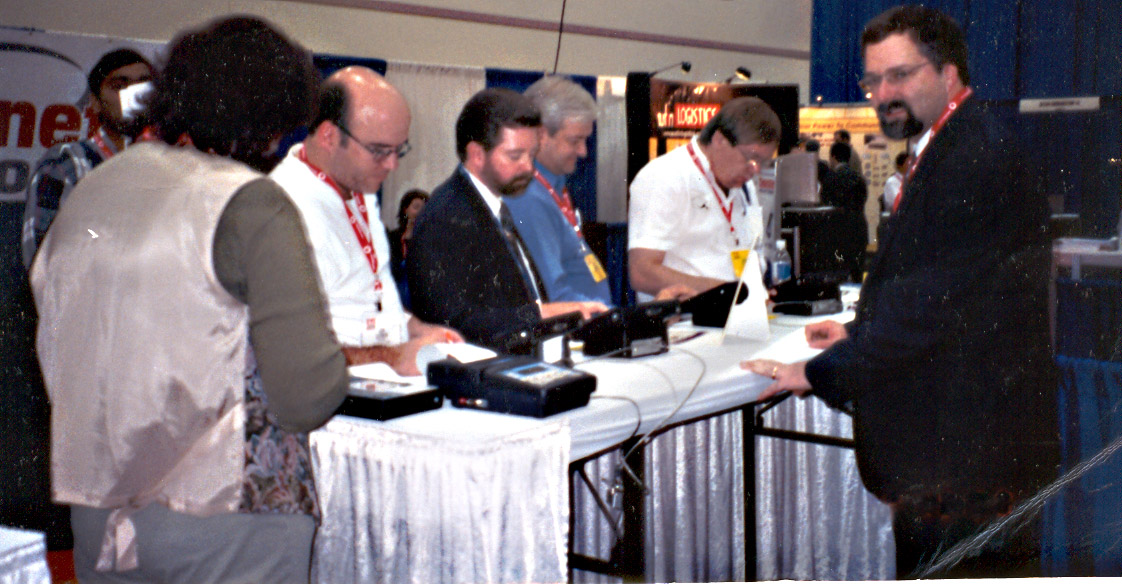
PICTURE OF TRADESHOW ATTENDEES AT RESEARCH BOOTH WITH SURVEY UNITS
CASE STUDY
Use Of Electronic Survey Units Onsite At Tradeshow
OBJECTIVE
A major publication & trade show company hosts an industry trade show in the Fall and Spring. Management wanted to measure the effectiveness of their trade show among three unique groups; conference attendees, exhibit-hall attendees, and exhibitors. Quick turnaround of survey results was imperative (within three weeks), since the information would be used for the new media kit.
METHOD
THE WAYMAN GROUP, INC. was commissioned to design a methodology that would interview all three groups onsite at the trade show. Four electronic survey units were programmed and positioned near the marketing booth in the exhibit hall. Sheldon Wayman, president, was the research facilitator at the booth. Survey topics included the following subject matter:
Exhibit-Hall Attendees:
- How exhibit-hall attendees heard about the trade show
- Major motivations for attending
- Plans for visiting an exhibitor as a result of seeing their ad in a publication (Which publication?)
- Buying actions taken at the show
- Influence of show on vendor selections and purchase decisions
- Plans for future attendance
- Other industry shows attended
- Preferred show in the industry
- Publications read regularly
- Sources useful in finding information about the marketplace
Conference Attendees (all of the above plus the following):
- Conference tracks that respondents did/will attend
- Rating of sessions and papers
Exhibitors:
- How exhibitors heard about the show
- Major motivations for exhibiting
- Plans to exhibit the following year
- Other industry shows exhibited at
- Preferred show in the industry
RESULTS
Within three weeks after the show, the Client received a comprehensive research report including data tables, executive summary and graphic depiction of survey results. A total of 400 respondents completed the survey on-site over a two-day period. Two-thirds or more of attendees indicated the show helped to influence purchase decisions and vendor selections. Over three-quarters of conference attendees do not attend another industry show, thus indicating an exclusive audience. 93% of exhibitors indicated plans to exhibit at the following year's show.
The Client’s marketing manager is currently incorporating the survey results into new sales promotional materials.